
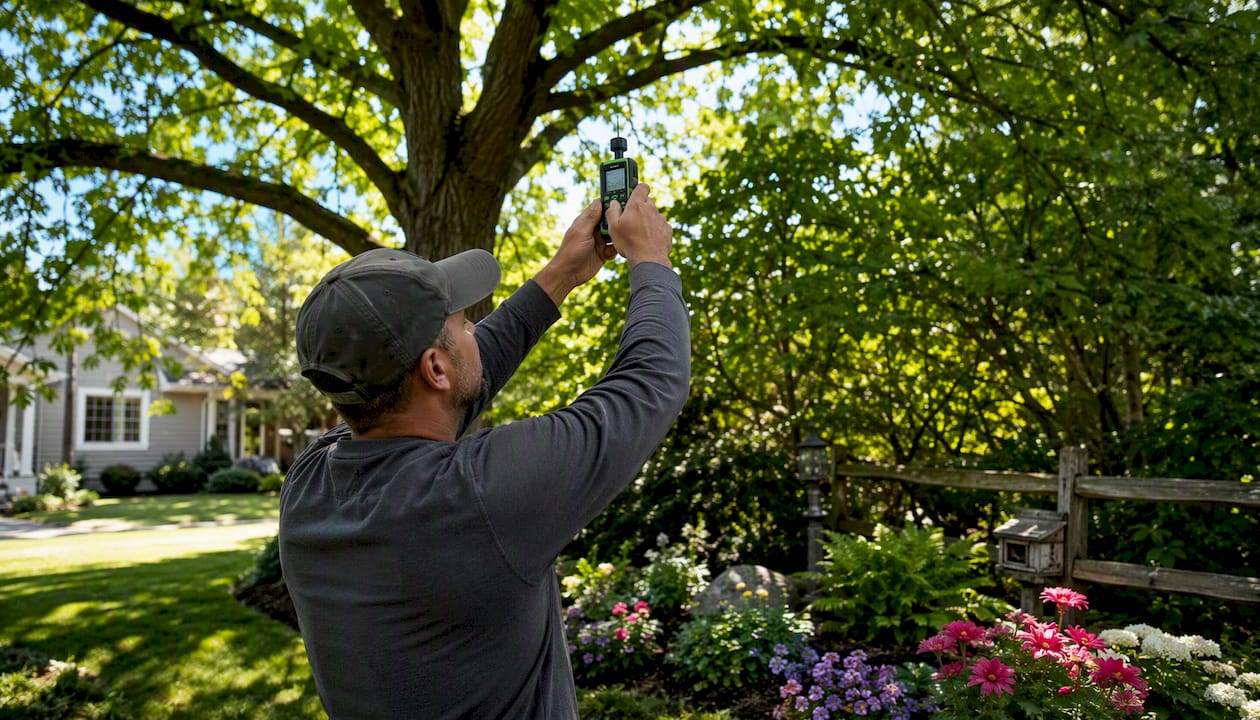
Tree canopy coverage is the percentage of a given land area covered by tree crowns when viewed directly from above, calculated as canopy area divided by total area, multiplied by 100. Planners and homeowners use this metric for two immediate purposes: making shading and cooling decisions at the property level, and setting community-wide Urban Tree Canopy (UTC) baselines that guide municipal planting targets. Three primary data sources give you reliable numbers for any U.S. location:
- US Forest Service Tree Canopy Cover (TCC): annual, 30-meter national maps
- NLCD Tree Canopy Cover: national land cover dataset with consistent methodology
- i-Tree Canopy: free, browser-based sampling tool for local estimates
Key Takeaways
Tree canopy coverage, expressed as the percent of ground area covered by tree crowns from above, is most useful when paired with the right dataset, the right measurement method, and property-level placement decisions that put trees where people actually live and work.
| Point | Details |
|---|---|
| Core definition | Tree canopy coverage = canopy area ÷ total area × 100, measured from directly above. |
| Three primary U.S. datasets | USFS TCC (30 m, annual), NLCD TCC (30 m, multi-year), and i-Tree Canopy (free, on-demand sampling). |
| Placement beats quantity | Canopy at 30–40% near homes delivers measurable cooling; scattered citywide coverage often does not. |
| Know the map’s limits | 30-meter products miss individual trees at the lot level; use high-res imagery or a site visit for property decisions. |
| Divinelandscapingllc | Provides site assessment, canopy-priority design, installation, and irrigation for NH and MA properties. |
Table of Contents
- What exactly does “tree canopy coverage” mean?
- How is tree canopy measured?
- Where do you find reliable U.S. canopy data?
- How do you calculate canopy cover for your property or neighborhood?
- How to read canopy maps without misinterpreting them
- Why does canopy coverage matter for your property and community?
- What canopy benchmarks and targets do cities use?
- How to maximize canopy benefits on your property
- A practitioner’s view on canopy as a long-term investment
- How Divinelandscapingllc can help you plan and grow your canopy
- Sources
What exactly does “tree canopy coverage” mean?
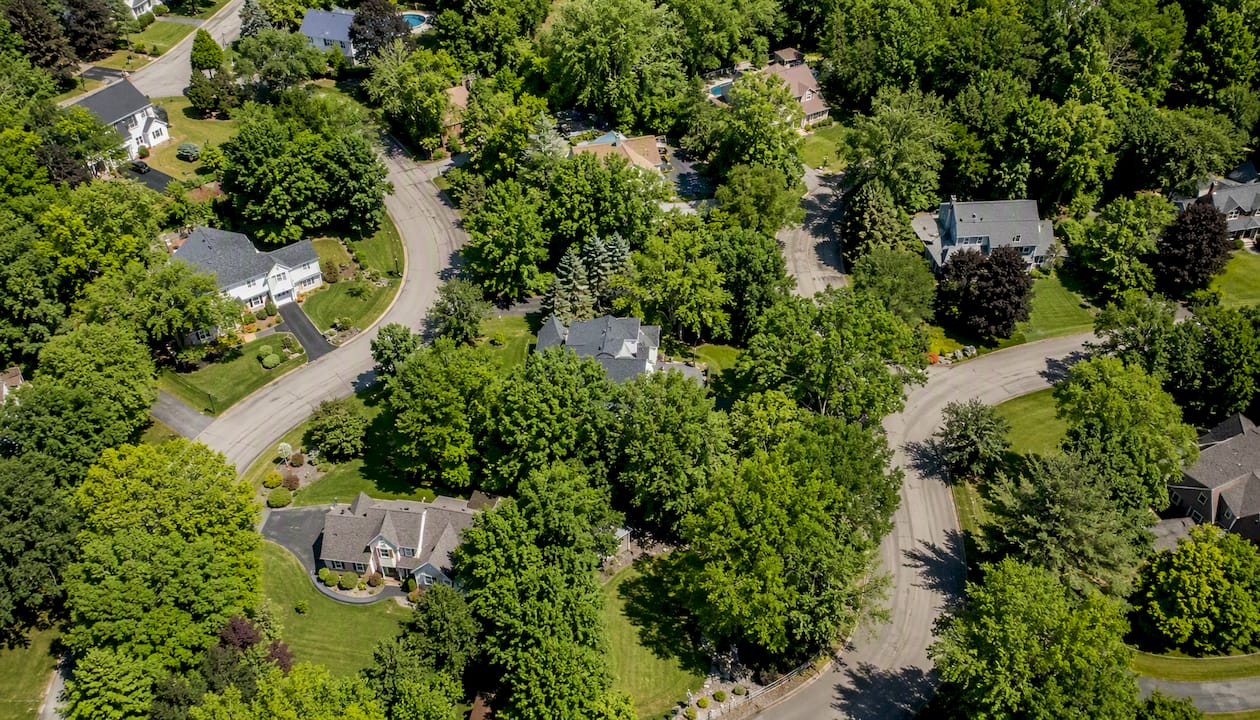
The technical definition is the vertical projection of tree crowns onto the ground surface, expressed as a percent of total ground area. Picture standing directly above a forest or neighborhood and tracing every leaf and branch onto the ground below. That traced footprint, divided by the total area you’re looking at, gives you percent canopy cover.
A few related terms show up in reports and maps, and they are not interchangeable:
- Urban Tree Canopy (UTC): canopy coverage measured specifically within a city or urbanized area, often paired with impervious surface and heat-island data to guide policy
- Tree Canopy Cover (TCC): the broader term used by the US Forest Service for both urban and non-urban mapping products
- Canopy cover vs. canopy density: cover is the footprint percentage; density refers to how thick or layered the canopy is within that footprint
- Existing canopy vs. possible canopy: existing is what’s there now; possible canopy identifies areas that could realistically support trees (unpaved, unobstructed ground)
The numbers vary widely by land type. According to USFS UTC guidance, UTC assessments are most useful when combined with impervious surface, socioeconomic, and heat-island data to guide planting priorities.
How is tree canopy measured?
No single method fits every scale or budget. The right choice depends on whether you need a quick neighborhood estimate or a precise, parcel-level map.
Field-based sampling
Plot sampling and point sampling place observers or photo points at systematic locations across an area. Trained crews record whether each point falls under tree cover. This approach remains the gold standard for ground-truthing remote sensing products. The US Forest Service uses Forest Inventory and Analysis (FIA) field plots as reference data to calibrate its TCC predictions.
Aerial and satellite imagery
Landsat and Sentinel satellites produce 30-meter pixels, meaning each pixel represents a 30×30-meter square on the ground. That resolution works well for regional trend analysis but can misplace or miss individual trees on a residential lot. High-resolution aerial orthophotos at 1-meter resolution capture individual crowns accurately and are the standard for city-level UTC studies.
LiDAR
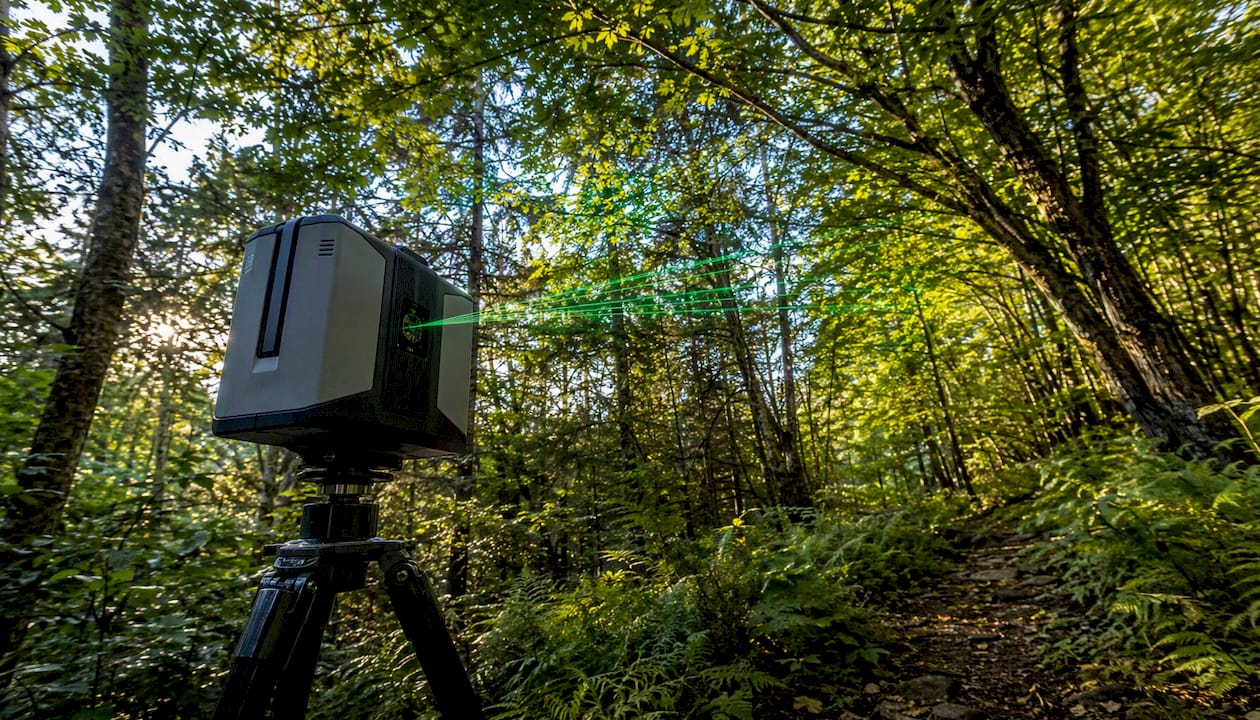
LiDAR (Light Detection and Ranging) uses laser pulses to measure height and structure, not just color. It distinguishes tree canopy from shrubs, rooftops, and other vegetation far more reliably than imagery alone. A PNW Research study by Ulmer et al. used 1-meter LiDAR-plus-imagery mapping to quantify canopy within 250 meters of residences and link those measurements to health outcomes, demonstrating the accuracy advantage over coarser products.
i-Tree Canopy sampling tool
i-Tree Canopy takes a different approach: it places random sample points over aerial imagery of a user-defined area, and you classify each point as tree, grass, impervious, water, or other. After enough points, it calculates a statistically valid canopy estimate along with carbon and avoided-CO₂ benefit figures. No GIS software required.
| Method | Spatial resolution | Separates trees from shrubs | Cost / access | Best scale | Update frequency |
|---|---|---|---|---|---|
| Field plot sampling | Sub-meter | High (trained observer) | High cost, slow | Site to small neighborhood | As-needed |
| Satellite imagery (Landsat/Sentinel) | 30 m | Moderate | Free (USGS/MRLC) | Regional to national | Annual |
| High-res aerial orthophoto | 1 meter | Good | Moderate (state/city programs) | City to neighborhood | Every 2–5 years |
| LiDAR | 1 meter | Very high | High cost | City to neighborhood | Every 5–10 years |
| i-Tree Canopy (random sampling) | Depends on imagery | Moderate (user-classified) | Free | Neighborhood to city | On demand |
Pro Tip: For a quick neighborhood estimate or grant application, i-Tree Canopy gives you a defensible number in under an hour. For a property-level decision, a site visit or high-resolution aerial review from a landscape professional will always outperform a 30-meter pixel product.
Where do you find reliable U.S. canopy data?
Several authoritative datasets cover the United States, each suited to a different purpose.
- US Forest Service TCC product suite: Annual 30-meter maps built from Landsat and Sentinel composites using machine-learning models, as described in the TCC Fact Sheet. Best for tracking regional trends and disturbance recovery over time. Download via the USFS Raster Gateway or view in Google Earth Engine.
- NLCD Tree Canopy Cover (MRLC): Part of the National Land Cover Database, available at mrlc.gov. Consistent national methodology, 30-meter resolution, useful for comparing canopy across states and time periods.
- i-Tree Canopy: Free browser tool at canopy.itreetools.org for local sampling. Best for community groups, urban foresters, and anyone needing a quick, low-cost estimate without GIS.
- Local UTC studies: Cities like Seattle publish their own high-resolution canopy studies with parcel-level data. Check your city or county GIS portal first.
- State-level UTC assessments: States like Wisconsin DNR conduct statewide UTC analyses using NAIP aerial imagery, producing both existing and possible canopy estimates for local planning.
| Dataset | Time range | Nominal resolution | Typical use |
|---|---|---|---|
| USFS TCC | Annual (present) | 30 m | Regional monitoring, trend analysis |
| NLCD TCC | Multi-year snapshots | 30 m | National comparisons, policy baselines |
| i-Tree Canopy | On demand | Imagery-dependent | Local estimates, community planning |
| Local/city UTC studies | Varies (present) | 1 meter | Parcel-level planning, municipal targets |
How do you calculate canopy cover for your property or neighborhood?
The formula is straightforward: canopy area divided by total area, multiplied by 100. Getting the inputs right is where the work happens.
DIY track: i-Tree Canopy
- Go to canopy.itreetools.org and create a free account.
- Draw your study area boundary on the map (your lot, a block, or a neighborhood polygon).
- Set your sample size. For a neighborhood of a few hundred acres, 500–1,000 random points gives a margin of error around 3–5%. Smaller areas need proportionally more points to hit the same confidence level.
- Classify each random point as tree canopy, shrub, grass, impervious surface, water, or other.
- Review the output: i-Tree Canopy reports percent canopy cover with a confidence interval and estimates carbon storage and annual CO₂ benefits.
Higher-accuracy track: GIS and imagery
For property-level decisions or permit applications, use high-resolution aerial imagery (1 meter or better) in a GIS platform like ArcGIS or QGIS. Digitize or auto-classify tree crowns, calculate the total crown area, and divide by the parcel area. LiDAR data, where available from your state or county, adds height filtering to eliminate shrubs and low vegetation from the count.
A few practical gotchas to watch for:
- Seasonality: leaf-off imagery in winter will undercount deciduous trees significantly. Use leaf-on imagery from late spring through early fall.
- Shadows: building shadows can be misclassified as tree canopy in automated analyses.
- Overlapping crowns: adjacent trees with touching canopies count as one contiguous patch; the total footprint is what matters, not individual trees.
- Possible vs. existing canopy: your calculation captures only what’s there now. Possible canopy requires a separate analysis of unobstructed, unpaved ground.
How to read canopy maps without misinterpreting them
Canopy maps are powerful planning tools, but every product has limits worth understanding before you act on the numbers.
Common limitations to watch for:
- 30-meter pixel products can place a tree in the wrong parcel or miss a single large tree entirely. A 30-meter pixel covers 900 square meters of ground, larger than many residential lots.
- Seasonal imagery used in national products may not reflect peak leaf-out conditions for your region.
- Mixed pixels at the edge of a tree crown blend canopy and pavement, pulling the canopy percentage down.
- Shrub misclassification is common in medium-resolution products; dense shrubs and low woody vegetation can register as tree canopy.
- Possible canopy vs. existing canopy is a critical distinction. A map showing 22% existing canopy in a neighborhood might also show 45% possible canopy, meaning nearly half the land could support trees. Planting targets should be set against possible canopy, not just the existing figure.
Accuracy matters most at the property scale. LiDAR-based products typically achieve higher accuracy for canopy extent than 30-meter satellite products. For any decision affecting a specific lot or block, high-resolution imagery or an on-site assessment is more reliable than a national dataset. Comparing canopy percentages between two years using different data sources or methodologies can produce apparent changes that reflect the mapping method, not actual tree gain or loss.
The TCC methods documentation explains exactly how pixel-level definitions and FIA reference sampling interact, which is worth reading before drawing conclusions from year-to-year TCC comparisons.
Why does canopy coverage matter for your property and community?
Tree canopy delivers measurable benefits across several categories, and the EPA’s summary of trees and vegetation benefits treats neighborhood canopy as a long-term resilience asset, not just an aesthetic feature.
Key ecosystem services tied to canopy coverage:
- Cooling and microclimate regulation: shade from tree canopy reduces surface temperatures and lowers cooling energy demand in nearby buildings.
- Stormwater interception: tree crowns intercept rainfall before it hits impervious surfaces, reducing runoff volume and peak flow rates.
- Carbon sequestration: trees store carbon in wood, roots, and soil over their lifetimes.
- Air quality: canopy filters particulate matter and absorbs some gaseous pollutants.
- Habitat connectivity: contiguous canopy supports bird and pollinator movement through urban areas.
- Property value: well-maintained trees and canopy are associated with higher residential property values. Divinelandscapingllc’s guide on property value landscaping for NH homeowners covers this connection in detail.
On the public health side, a study by Ulmer et al. found that more neighborhood tree cover was associated with better self-reported general health and lower obesity prevalence in the study area, using 1-meter LiDAR mapping within 250 meters of residences.
Cooling effectiveness depends heavily on placement. Research published in Nature Communications found that canopy needs to reach approximately 30–40% cover near homes to deliver measurable cooling benefits, and that canopy within roughly 60 meters of buildings and public spaces delivers far more benefit than the same canopy scattered across a city. Citywide averages can mask neighborhoods with almost no shade at all.
What canopy benchmarks and targets do cities use?
Key points about how targets are set:
- UTC assessments produce both an existing canopy figure and a possible canopy figure. The gap between them defines the realistic planting opportunity.
- Goals are phased: a city at 18% existing canopy with 38% possible canopy might set a 10-year goal of reaching 25%, not 38%, because tree growth takes decades.
- Equity considerations shape where targets apply. Planners prioritize low-canopy, high-heat neighborhoods rather than adding trees where canopy is already dense.
- UTC assessments are typically repeated every 5–8 years to track progress and update possible canopy estimates as land use changes.
State-level programs, like Wisconsin DNR’s UTC analysis, illustrate how statewide aerial imagery can produce consistent existing and possible canopy estimates that local communities use to set realistic goals.
How to maximize canopy benefits on your property
Research points clearly to one principle: proximity matters more than quantity. Canopy close to your home, patio, or driveway delivers cooling and comfort benefits that the same trees planted at the back of a large lot cannot match.
A practical design checklist for maximizing canopy on a residential or commercial property:
- Plant on the south and west sides of buildings first. These exposures receive the most direct sun in summer and benefit most from afternoon shade.
- Choose appropriate species for your soil, climate zone, and available space. A tree that reaches 60 feet at maturity needs room; a narrow lot may call for a columnar or smaller-canopy species.
- Provide adequate soil volume. Trees in compacted, undersized pits rarely reach canopy-providing maturity. Structural soil cells or continuous trenches under pavement give roots room to grow.
- Avoid narrow tree pits in paved areas. A 4×4-foot opening is not enough for a street tree expected to provide meaningful canopy in 20 years.
- Plan for irrigation in early years. Newly planted trees need consistent moisture for the first 2–3 growing seasons. Divinelandscapingllc’s irrigation services can be integrated into a planting plan from the start.
- Check utility locations and permits before planting. Overhead lines and underground utilities constrain species choice and placement. Call 811 before any planting project.
- Consider larger planting stock. A 3-inch caliper tree establishes faster and provides shade sooner than a 1-inch whip, though it costs more upfront.
Regular tree trimming and structural pruning in the first decade shape a tree’s crown for long-term canopy coverage and reduce the risk of storm damage. Proper tree maintenance also extends the productive life of mature trees, which are the most valuable canopy assets on any property.
Pro Tip: When choosing between planting one large-caliper tree near your home and three small trees scattered across the yard, the single well-placed tree will usually deliver more measurable cooling benefit within 10 years. Strategic placement consistently outperforms raw tree count.
A practitioner’s view on canopy as a long-term investment
Canopy work is slow by nature, and that’s the part most clients don’t fully anticipate at the start of a project. A tree planted today at 2 inches in caliper might reach meaningful canopy coverage in 15–20 years. That timeline shapes everything: species selection, placement decisions, and maintenance commitments all need to account for where the tree will be in two decades, not just next spring.
The most common question I hear from property owners is whether they should plant now or wait until they have a full landscape plan in place. The answer is almost always to plant now, but plant strategically. A tree in the wrong spot, too close to a foundation or under a utility line, creates problems that cost more to fix than the tree was worth. Getting placement right from the start, with a clear understanding of mature size, root behavior, and site conditions, is where professional guidance pays off most. Realistic expectations around cost, growth timeline, and annual maintenance are what separate a thriving canopy from a yard full of struggling trees that never quite deliver.
How Divinelandscapingllc can help you plan and grow your canopy
Knowing your canopy percentage is the first step. Turning that number into a better, cooler, more valuable property is where professional design and installation make the real difference.
Divinelandscapingllc works with New Hampshire and Massachusetts homeowners and commercial property managers to design and install canopy-focused landscapes that deliver results over the long term. Services include site assessment, species selection matched to your soil and climate, canopy-priority planting plans, irrigation system installation to support establishment, and ongoing maintenance coordination. Unlike a DIY approach, a professional assessment accounts for utility locations, permit requirements, soil preparation, and mature tree size before a single hole is dug.
For commercial properties, the multi-tenant property landscaping guide covers how canopy planning integrates with site design at scale. Homeowners ready to start with a full design can explore landscape design services for New Hampshire properties and request a consultation.
Sources
- Benefits of Trees and Vegetation (U.S. EPA)
- Mapping Tree Canopy Cover — TCC Fact Sheet (U.S. Forest Service, 2024)
- TCC v2025-6 Methods (U.S. Forest Service)
- Ulmer et al. — Tree cover and health associations (PNW Research, 2016)